Time axis on Time Series-Pane reads walltime incorrect #4541
Labels
Comments
|
Hi @Talon24! Thanks for the report. I can reproduce this; it’s a |
wchargin
added a commit
that referenced
this issue
Jan 14, 2021
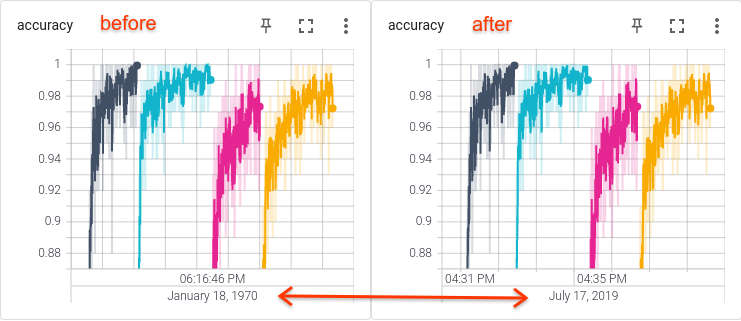
Summary:
The TensorBoard backend sends wall times in floating-point seconds since
epoch, and the scalars dashboard interprets them accordingly. But the
time series dashboard was interpreting them as milliseconds since epoch,
causing recent dates to be rendered around January 1970. This patch
fixes the frontend to multiply by 1000, as the scalars dashboard does.

This bug also affected relative times, which were shown compressed by a
factor of 1000 on the horizontal axis (but not in the tooltips). This
bug did not affect GPU line charts.

Fixes #4541.

Test Plan:

![Comparison screenshot of two chart views in the time series dashboard.
Before: the wall time spans a single second, labeled “06:16:46 PM
January 18, 1970”. After: the wall time starts on “04:31 PM July 17,
2019” and ends at “04:35 PM July 17, 2019”.][ss]

[ss]: https://user-images.githubusercontent.com/4317806/104562449-3a695300-55fd-11eb-81e9-15377175dfa4.png

wchargin-branch: metrics-date-milliseconds
wchargin-source: 4035248298114f38528aa16e54a1a459c39d4dc9
wchargin
added a commit
that referenced
this issue
Jan 14, 2021
Summary:
The TensorBoard backend sends wall times in floating-point seconds since
epoch, and the scalars dashboard interprets them accordingly. But the
time series dashboard was interpreting them as milliseconds since epoch,
causing recent dates to be rendered around January 1970. This patch
fixes the frontend to multiply by 1000, as the scalars dashboard does.

This bug also affected relative times, which were shown compressed by a
factor of 1000 on the horizontal axis (but not in the tooltips). This
bug did not affect GPU line charts.

Fixes #4541.

Test Plan:

![Comparison screenshot of two chart views in the time series dashboard.
Before: the wall time spans a single second, labeled “06:16:46 PM
January 18, 1970”. After: the wall time starts on “04:31 PM July 17,
2019” and ends at “04:35 PM July 17, 2019”.][ss]

[ss]: https://user-images.githubusercontent.com/4317806/104562449-3a695300-55fd-11eb-81e9-15377175dfa4.png

wchargin-branch: metrics-date-milliseconds
Sign up for free
to join this conversation on GitHub.
Already have an account?
Sign in to comment
Environment information
Diagnostics
Diagnostics output
Time Series- Pane:Scalars- PaneIssue description
On the
Time Series- Pane, the x-axis with a time scale is wrong, it shows a date in 1970.In the tooltip, the date is correct, and on the
Scalar-pane, both is correct.I have set the
horizontal axis- option toWall, and my data is written bywriter.add_scalar()It seems that on the x-axis wants to take a millisecond-timestamp, but gets a regular timestamp; When i multiply my timestamp by 1000, the axis on that pane is correct, but not the tooltip or the other pane.
Reproduction
See how this stretches over some months in the current year as expected on the Scalars pane, but only 2 hours of 1970 on the Time Series pane
The text was updated successfully, but these errors were encountered: